WISE colours?
-
 by
sisifolibre
by
sisifolibre
There are a "simple" way or some guidelines to learn how to distinguish WISE "colours"?, and which of them are usual for AGN, QSO, stars, etc...
I sometimes read comments like this "it doesn't have AGN/QSO WISE colors" from #HAndernach. I guess this kind of comments are refered to the looking of the object in different bands or wavelength in infrared, but I would like to learn more about it..
The WISE link is the less used in my hunt of rare subjects, and I haven't find more specific info about how to exploit it in this forum. Out of the forum I feel lost very quickly 😦
(I really don't know why I haven't asked this before).Posted
-
 by
JeanTate
in response to sisifolibre's comment.
by
JeanTate
in response to sisifolibre's comment.
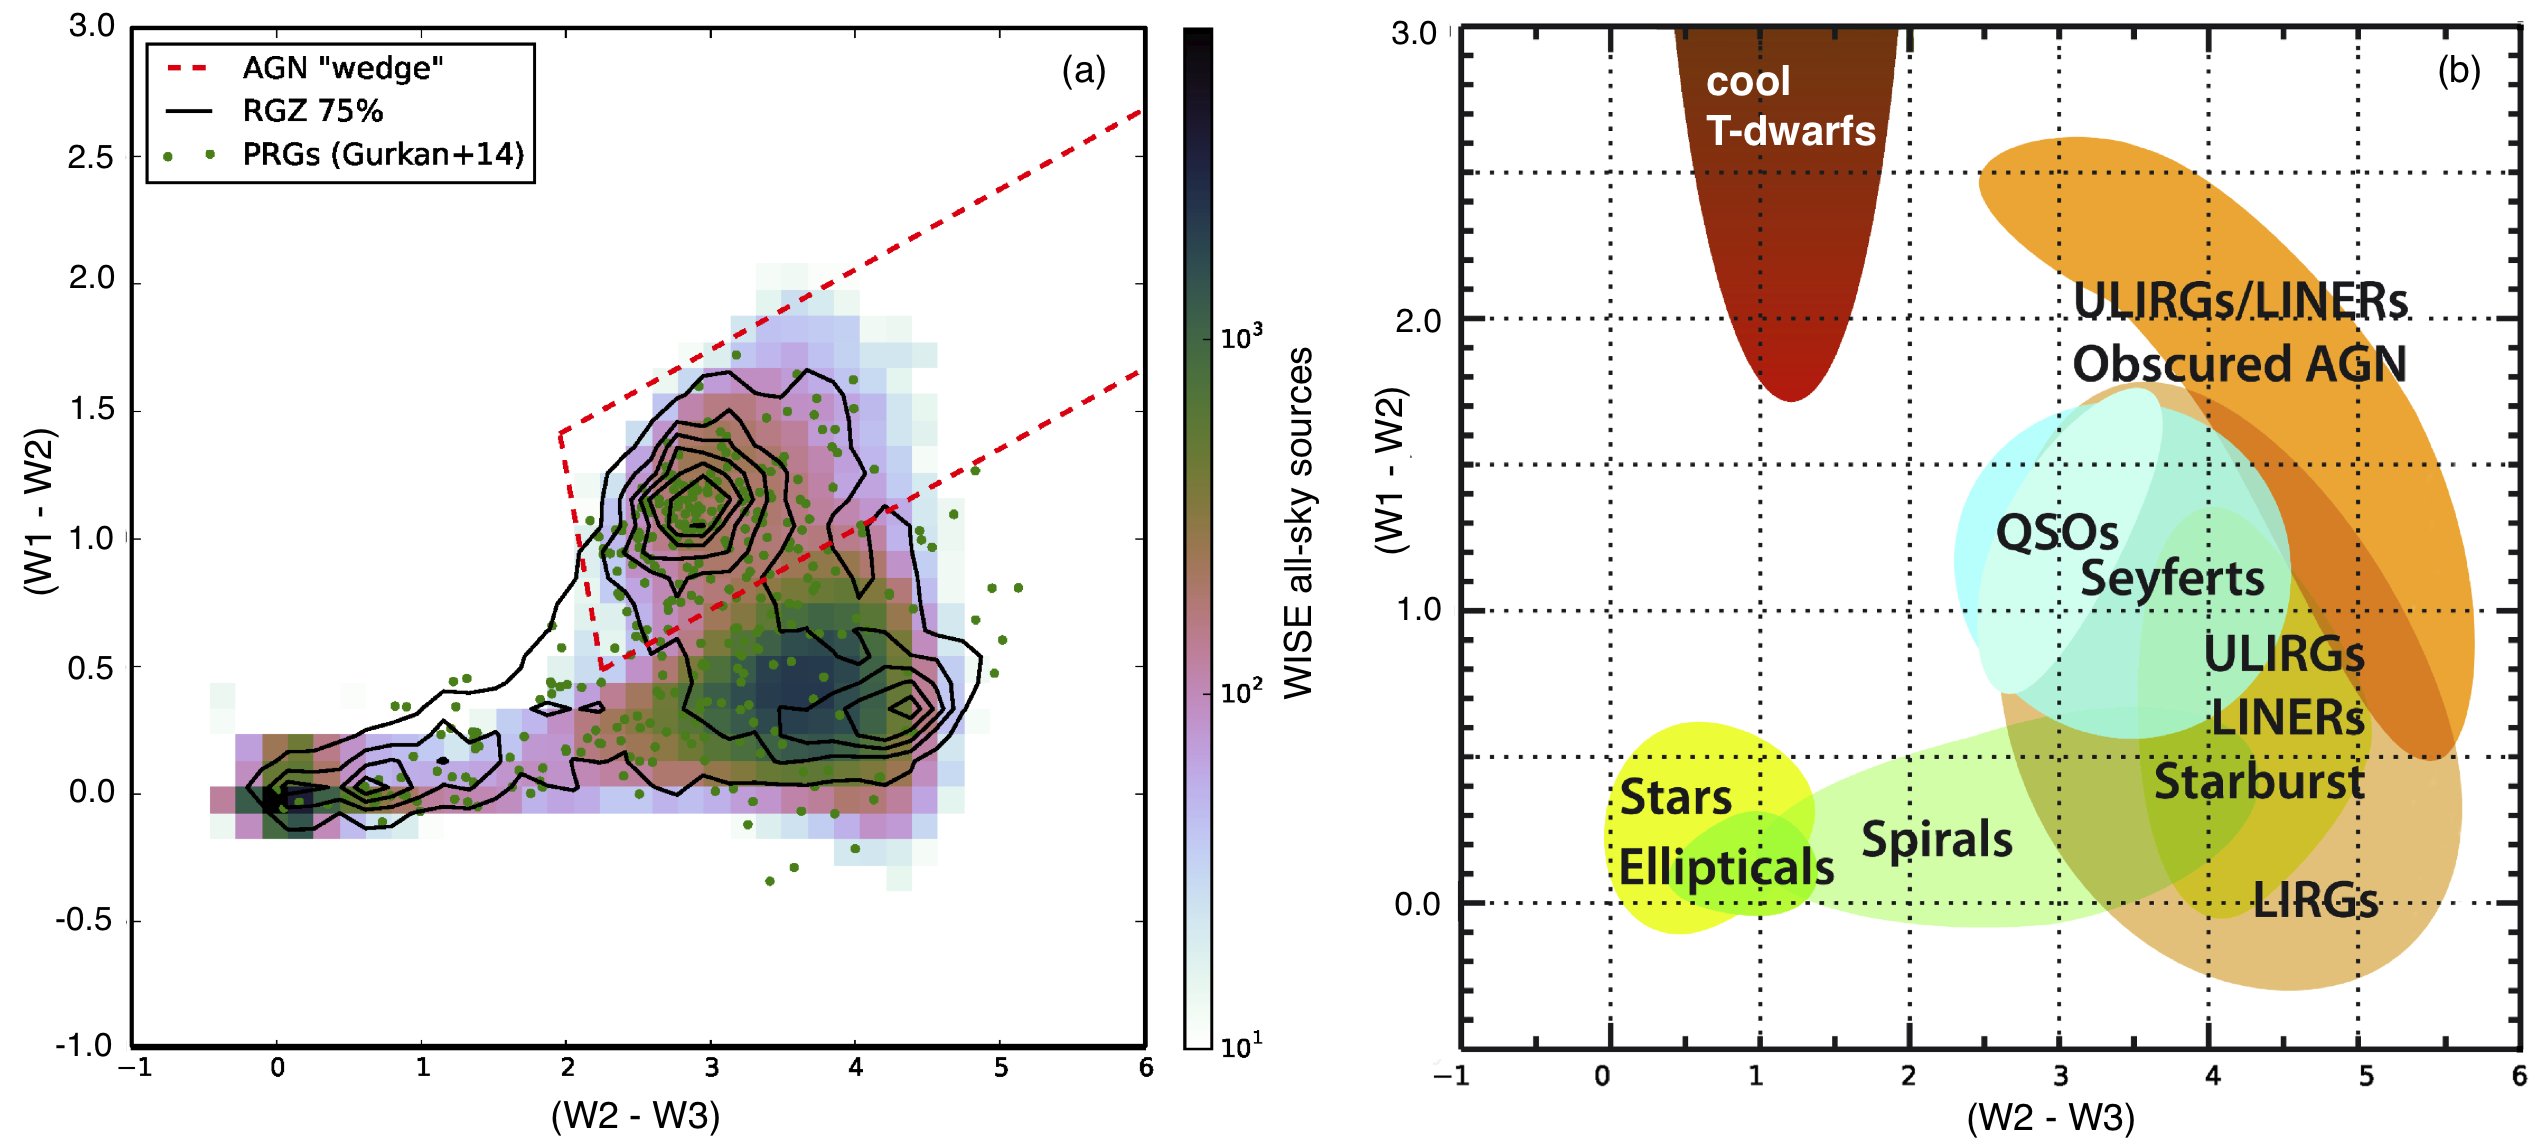
I'm not sure if there is a "simple" way to make such distinctions, but this GZ blog post, from 2015, "First Radio Galaxy Zoo paper has been accepted!", contains a pair of diagrams showing (W1-W2) and (W2-W3) colors, with the second one (on the right) indicating regions in that color-color diagram where various types of sources are commonly found:
Maybe a radio astronomer could drop by and add more detail?
Posted
-
by
sisifolibre
Thanks Jean, it's a first step...
I have tried it, but I don't understad well this diagram. How do I find these numerical values on the WISE page? They don't use the W4? why is w2 in the x and y coordenates....
Posted
-
by
JeanTate
in response to sisifolibre's comment.
How do I find these numerical values on the WISE page?
I don't think you can, or at least not easily; at least, it's not something I know how to do.
You can look up the WISE magnitudes in a WISE catalog: you have the coordinates (for this field, the source is in the center, coinciding with the radio source), so it's relatively straight-forward. Do you know how to use VizieR, say, to get data from a catalog?
They don't use the W4?
W4 has far fewer detections than the other three bands, so there is much less color data using W4. Of course, a color-color diagram with one color defined by W4 is possible, but I don't know if there are obvious regions like in the above diagram.
why is w2 in the x and y coordenates
They're just colors that are being plotted, and colors - in astronomy - are defined as the differences in magnitudes in sets of bands. From SDSS data, for example, where there are five bands, there are many different colors: u-g, u-r, u-i, u-z; g-r, g-i, g-z; r-i, r-z; i-z (they're the same, but of opposite sign, if done the other way, e.g. g-u). Some of these are quite helpful, in terms of the astrophysical processes which give rise to them; others much less so.
Hope this helps.
Posted
-
by
sisifolibre
in response to JeanTate's comment.
Do you know how to use VizieR, say, to get data from a catalog?
Yes! It's easy with Aladin and/or VizieR. At last for the kind of data that I can understand... magnitudes are easy to find.
They're just colors that are being plotted, and colors - in astronomy - are defined as the differences in magnitudes in sets of bands. From SDSS data, for example, where there are five bands, there are many different colors: u-g, u-r, u-i, u-z; g-r, g-i, g-z; r-i, r-z; i-z (they're the same, but of opposite sign, if done the other way, e.g. g-u). Some of these are quite helpful, in terms of the astrophysical processes which give rise to them; others much less so.
This is new for me, now you can see how much of the basics I must to learn... My thougt was that colours are the same that bands.
Please tell me if I'm correct: Each band is a wavelenght (or a range of wavelenght). Then a "color" (colour) in this case mean something very different that when we say that a galaxy is green for example.A practice exercise: SDSS J151816.43+220748.6 have colours in WISE:
w1-w2: 17.546-16.459=1,087;
w2-w3: 16.459-12.981=3,478Considering the diagram, and that we don't see radio emission from it, the galaxy SDSS J151816.43+220748.6, is a LIRGs (or Luminous Infrared Galaxy), almost a ULIRG.
Or I'm confusing everything...
Posted
-
by
sisifolibre
And how confidable is the diagram? It can give us more information and a better criteria in the search of SDRAGN or radiostars?
I see that spirals usually show different colours than elliptical. But I have been testing some subjects and seem that I find too much galaxies that fall in the group of spirals..
Posted
-
 by
HAndernach
scientist, translator
by
HAndernach
scientist, translator
Thanks, Jean, for explaining most of sisifolibre's doubts. A color in astronomy
is indeed the difference between two magnitudes, usually shorter minus longer
wavelength, such that a positive color means "redder". The online SDSS images
show color because they are a composite of r,g,i filter images, although the
colors are somewhat subjective. The WISE color diagram (right-hand side of JT's
message) is from Wright et al. 2010, who unfortunately do not say which samples
exactly they used to obtain the regions in this color-color diagram for the
different object types. Since then, other authors have done similar diagrams (e.g.
2014MNRAS.442.3361N, 2015ApJS..221...12S, 2018A&A...618A.144G, 2018ApJS..234...23A
to name just a few. Concerning real stars, apart from their spectrum, one
can recognize them either by a significant parallax or a proper motion in Gaia DR2
in VizieR, but also by "neutral" colors, meaning that W1-W2 and W2-W3 is near zero.
Recently, 2018ApJS..235...10K have produced a diagram (their Fig. 2) that allows
one to estimate a very crude redshift from WISE colors, but ONLY if the object
is a QSO. The articles mentioned here can be found going to http://adsabs.harvard.edu/abs/
and adding these 19-digit "bibcodes".Posted
-
by
JeanTate
in response to HAndernach's comment.
Thanks HAndernach.
The articles mentioned here can be found going to http://adsabs.harvard.edu/abs/ and adding these 19-digit "bibcodes".
Some browsers can make a mess of doing this. Here are the papers as they appear in ADS, as URLs:
-
Wright et al. 2010: "The Wide-field Infrared Survey Explorer (WISE): Mission Description and Initial On-orbit Performance"
-
2014MNRAS.442.3361N: Nikutta+ (2014), "The meaning of WISE colours - I. The Galaxy and its satellites"
-
2015ApJS..221...12S: Secrest+ (2015) "Identification of 1.4 Million Active Galactic Nuclei in the Mid-Infrared using WISE Data"
-
2018A&A...618A.144G: Guo+ (2018) "Identifying quasars with astrometric and mid-infrared methods from APOP and ALLWISE"
-
2018ApJS..234...23A: Assef+ (2018) "The WISE AGN Catalog"
-
2018ApJS..235...10K: Krogager+ (2018) "MALS-NOT: Identifying Radio-bright Quasars for the MeerKAT Absorption Line Survey"
Posted
-
-
by
sisifolibre
Thank you very much H. Andernach and Jean Tate!
Here I have learn a lot, and I hope it will be didactic for others too!No dobut that is useful for investigation around radio stars, and seems spectacular the result of estimate z only with WISE.
Jean what do you think about use of these WISE colors in the search of SDRAGN? if there are a significative difference in colours between elliptical and spiral it can be evidence for some subjects. Sadly this doubts about the samples on Wright et al. 2010 are a problem... but I see that his colour-colour appear in some of these articles and is well consideredPosted