New: gold standard images
-
 by
KWillett
scientist, admin, translator
by
KWillett
scientist, admin, translator
(cross-posted from the RGZ blog at this URL)
First off, the science team for Radio Galaxy Zoo wants to thank our volunteers for their continued clicks, discussion on Talk, and continued participation in the project. As of today, we have 892,582 classifications on RGZ and over 45,000 subjects completed from the FIRST-SDSS sample. We absolutely could not do this without you, and we're working hard on turning the data into interesting science.
We want to let you know of some particular galaxies that will be appearing slightly more often in the interface. One of the things I've been working on for Radio Galaxy Zoo over the last month is finding better and smarter ways of combining clicks from independent classifiers into the "final answer" for each galaxy. For past Zooniverse projects, we've been able to do this using relatively simple methods - users are weighted a little bit by their consistency with other volunteers, but the final data product is mostly just the vote fractions for various tasks. However, the task in RGZ is a bit more complex, and the simpler methods of combining classifications are proving very difficult. In order to accurately combine the information each volunteer gives us, we need to establish a bit more common ground than we currently have.
To calibrate the clicks across all citizen scientists, we need to look at galaxies that the same people have done. The science team has started this by labeling the correct morphologies (to the best of our abilities) for a smaller, "gold standard" sample. We use these as seed weights in our data reduction - that lets us calibrate users who have done the gold standard galaxies. These results are propagated outward to the full sample by looking at other galaxies done by both calibrated and uncalibrated users, and so on. Kind of like pulling ourselves up by the bootstraps. 😃
What we're missing right now, though, are galaxies that lots of citizen scientists have jointly classified. Since each galaxy is retired after 20 people classify it, the chances of seeing a particular galaxy is pretty low. Some members of the science team, including myself, recently sat down with a sample of 100 galaxies taken from a combination of random selection and ones you've identified on Talk as having interesting or non-trivial morphologies (bent jets, triple systems, giants, no IR counterparts, etc). These is what we'd like to use for calibration. However, only about a dozen users so far have done enough of this sample to give us enough data for calibration.
So, in order to help the accuracy of the data pipeline, we've chosen 20 "gold standard" galaxies that will eventually be shown to all volunteers. They won't all be in one bunch (you should see one every five subjects or so) and you shouldn't see any galaxies that you've classified before. We'll label the galaxies on Talk - look for the hashtag #goldstandard. I hope that another positive outcome will be users getting to discuss interesting features in galaxies that they haven't come across before. After you've done all 20 galaxies in the sample, your future classifications will be randomly selected as usual.
Please let us know on this board if you have any questions about this --- I'll be happy to discuss it further. Thanks again for all of your help - we hope this will let us produce a more accurate RGZ product and science papers in the coming year!
Posted
-
 by
DZM
Zooniverse Team
by
DZM
Zooniverse Team
@KWillett, thanks for this fantastic behind-the-scenes look and update!
It's always great to get a look at the process that translates our citizen scientists' classification work into solid science, and to know the rationale behind the stuff that we're all seeing.
Thank you again!
Posted
-
 by
JeanTate
by
JeanTate
@KWillett: Not sure if you intended to post the two images (in the blog post) here or not, but I think it helps. So here goes.
The first appears in the line after the smilie 😃
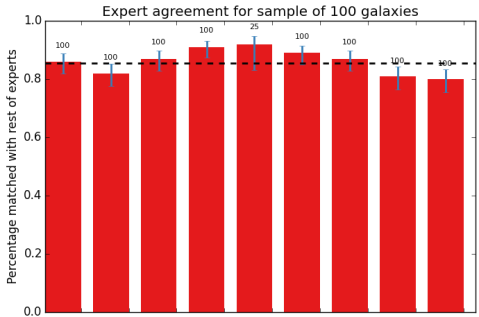
The text (caption) under this image reads:
Result of the science team classification of a small sample of 100 RGZ galaxies. The height of the bar represents how well a particular science team member agreed with the others. As a group, the results show very good consistency overall, near 90%. Using the results from this sample, we can apply similar calibrations to the tens of thousands of galaxies that RGZ citizen scientists are helping us with.
The second appears just before the last para:

The text (caption) under this image reads:
ARG0001e8e – a very nice core + hotspot system, and slightly challenging morphology to classify. This is one example of the 20 “gold standard” galaxies we’re trying to have everyone in RGZ classify.
Posted
-
 by
Ptd
by
Ptd
Are individual users supposed to be shown each of these Gold Standard image more than once? I have now been shown at least three of them twice.
Posted
-
by
KWillett
scientist, admin, translator
in response to JeanTate's comment.
Thanks, @JeanTate - inline images don't cross over in the same way between Wordpress and Talk posting. I think they're helpful examples, so thanks for putting them up.
Posted
-
by
KWillett
scientist, admin, translator
in response to Ptd's comment.
Hi @Ptd,
No - you're definitely only supposed to see each of them just once (and then never again). Could you tell me which image(s) you saw twice, and the time if you know it? I'll check as soon as possible to see what's going on.
Posted
-
by
JeanTate
in response to KWillett's comment.
You're welcome.
I'm not sure I really understand the bar chart; could you explain it in a bit more detail please?
For example:
- a red bar is the percentage of matches of ONE Science Team member (call her A) with the matches of the (N-1) other science team members who classified, for ONE galaxy? (this doesn't quite make sense to me)
- a red bar is the percentage of matches of ALL Science Team members with the matches of ALL the (N-1) other science team members who classified, for ONE galaxy? (if the Science Team had just three members - A, B, and C - and all three classified that ONE galaxy, there would be three matches (AB, AC, and BC) to consider)
- matches for nine different galaxies are shown
- what are the blue bars?
- what are the numbers above them (100, eight times, and 25 once)?
- what is the black horizontal dotted line? It seems to be some kind of mean; weighted? of just these nine galaxies?
Posted
-
by
Ptd
in response to KWillett's comment.
Hi KWillett
http://radiotalk.galaxyzoo.org/#/subjects/ARG0000jqj
http://radiotalk.galaxyzoo.org/#/subjects/ARG0001fsn
These are two of them, I posted comments in both which should give you time stamps?
I'm using Chrome.
KR
Update:
Another one:Image ARG0001p9x, just had this for a second time, during two different internet sessions;
And now this one: Image ARG0000lv1; + Image ARG0002ato; +Image ARG000051q(seen 3 times); +Image ARG000090l(seen 3 times)In case I am queering the data with all these multiple classifications, which you will then have to spend hours undoing or have to throw all the classifications for that object away, I think I'll stop now. If/when it is OK for me to start classifying again please can someone official PM me, to my registered email address.
MT
PtdPosted
-
by
KWillett
scientist, admin, translator
Thanks for the details and follow-up. I've passed all this to the developers - hopefully it will be fixed as soon as possible. I'll update here as soon as I know more.
Posted
-
by
KWillett
scientist, admin, translator
in response to JeanTate's comment.
Hi Jean,
Each bar represents the sum of classifications by a person (member of the science team), rather than an individual galaxy. So the first bar, for example, shows one science team member who agreed with the consensus for about 87/100 galaxies in the sample. All nine members of the science team agreed between 80 and 90% of the time. The blue bars show the estimated errors on the fraction (just based on binomial statistics), and the number above the bar gives the total number of galaxies that classifier completed. 8/9 people finished the whole sample; 1 person only did 25, but I've included their results anyways. The black dotted line shows the mean for the nine of us, which is about 85%.
The agreement rate is probably better than 85%, for a couple reasons. First, the galaxies we did weren't randomly selected - we emphasized images with difficult morphologies, with lots of radio components and complicated structures. So if we had done a random sample of galaxies, with more compact or simple features, our agreement rate would be likely be much closer to 100%. Secondly, this is the result of an early (and evolving) version of the RGZ algorithm. It only considers "total agreement" - users must match all radio components in each galaxy exactly, or it's considered wrong. Examining some of these images manually and talking to each other after the fact, there were a few cases where it's clear that we agreed on the overall morphology, but occasionally missed a tiny radio component and thus were flagged by the pipeline. I'm trying to adapt the consensus algorithm in order to account for these measures of partial agreement - the more information we can get out of the clicks, the better the final identifications will be.
Posted
-
by
KWillett
scientist, admin, translator
in response to Ptd's comment.
Hi Ptd,
The developers have been looking into the issues you reported. So far, it appears to be an isolated case - we haven't had any other users report repeat classification of the g.s. sample. Object ARG000051q has been manually added to your "already seen" list, so that shouldn't show up again.
Would you mind trying a few more classifications soon and seeing whether it's still persisting?
Posted
-
by
JeanTate
in response to KWillett's comment.
Thanks Kyle.
So the first bar, for example, shows one science team member who agreed with the consensus for about 87/100 galaxies in the sample.
So "the consensus" here means, for each object, something like "the classification with the greatest number of 'votes', by the nine science team members"? And that consensus includes that particular science team member's classification too, or does it exclude it? I ask this latter because the caption reads "The height of the bar represents how well a particular science team member agreed with the others." (my bold).
In this exercise, were the science team members offered a fixed choice of classifications, or were they free to classify any way they wanted? If the latter, how did you determine the modal classification?
Did any of the objects have a notably bimodal classification distribution? I.e. one where a significant minority of science team members agreed on a classification that was different from that of the majority?
You write, "... agreed with the consensus for about 87/100 galaxies in the sample" (my bold)
How did the science team members know that what they were classifying was a galaxy (and not an overedge lobe, say)? When I classify RGZ images, I do not know where the galaxies are, and when I click 'discuss' and check FIRST and SDSS (occasionally NVSS too), I sometimes find the host which I marked - on the WISE image - is not a galaxy, or not the host of the observed radio structure.
The blue bars show the estimated errors on the fraction (just based on binomial statistics)
Would you clarify this please? I know what "binomial statistics" is, but exactly what do you mean here?
this is the result of an early (and evolving) version of the RGZ algorithm. It only considers "total agreement" - users must match all radio components in each galaxy exactly, or it's considered wrong.
Is this used (or has this been used) to evaluate/score/etc ordinary RGZ zooites' clicks so far too?
Examining some of these images manually and talking to each other after the fact, there were a few cases where it's clear that we agreed on the overall morphology, but occasionally missed a tiny radio component and thus were flagged by the pipeline. I'm trying to adapt the consensus algorithm in order to account for these measures of partial agreement - the more information we can get out of the clicks, the better the final identifications will be.
Here's another aspect I think you should work on (and I'd be happy to help): science team member DocR made a comment - somewhere in RGZ Talk - to the effect that ARG fields with more than one independent source will be very difficult to assess, in that the RGZ algorithm(s) won't really know how to handle independent radio sources which are not in the center. After reading that, I pretty much stopped marking such independent sources, and I suspect several of the other 'high click count' zooites did the same too. Of course, in some of these cases the ambiguity (?) can be removed because the second (etc) source(s) will turn up in a different ARG field; however, there are also quite a few ARG fields with multiple, independent sources (e.g. some centers of rich clusters), and in these fields this 'appears in a separate ARG field' won't help much.
Could you say a bit more about these consensus RGZ algorithms please?
Posted
-
by
KWillett
scientist, admin, translator
in response to JeanTate's comment.
Hi Jean,
So the first bar, for example, shows one science team member who
agreed with the consensus for about 87/100 galaxies in the sample.So "the consensus" here means, for each object, something like "the
classification with the greatest number of 'votes', by the nine
science team members"? And that consensus includes that particular
science team member's classification too, or does it exclude it? I ask
this latter because the caption reads "The height of the bar
represents how well a particular science team member agreed with the
others." (my bold).That's right. For this comparison, it's a simple check on the classification with the greatest number of votes. Specifically, that corresponds to the number of IR sources and the specific radio components. It doesn't require agreement for the location of the IR counterpart, since that's not a clear distinction. We measure the best fit position using a clustering algorithm for that, but users are almost always in agreement on the location of the counterpart if they agree on the radio lobes.
In this exercise, were the science team members offered a fixed choice
of classifications, or were they free to classify any way they wanted?
If the latter, how did you determine the modal classification?The experts classified in exactly the same way as the RGZ citizen scientists did, with a blindly selected sample and the same interface. Once all classifications were done and analyzed, we did discuss some individual objects and classifications. This helped us identify errors (ie, an errant click) vs. genuine disagreements, and helped us select the final 20 for the gold sample.
Did any of the objects have a notably bimodal classification
distribution? I.e. one where a significant minority of science team
members agreed on a classification that was different from that of the
majority?For some galaxies, yes - about 15% of the sample overall. Only 1 or 2 of those are in the gold standard, though - it's most useful for us if the common sample are galaxies that the science team agrees on and that have a definite label in the data pipeline.
You write, "... agreed with the consensus for about 87/100 galaxies in
the sample" (my bold)How did the science team members know that what they were classifying
was a galaxy (and not an overedge lobe, say)? When I classify RGZ
images, I do not know where the galaxies are, and when I click
'discuss' and check FIRST and SDSS (occasionally NVSS too), I
sometimes find the host which I marked - on the WISE image - is not a
galaxy, or not the host of the observed radio structure.A couple of the galaxies we disagreed on did turn out to be #overedge sources - this image, for example got 4/8 science team members who thought all radio components were from the same galaxy, and 4 who didn't. http://radiotalk.galaxyzoo.org/#/subjects/ARG0002qfa
The blue bars show the estimated errors on the fraction (just based on
binomial statistics)Would you clarify this please? I know what "binomial statistics" is,
but exactly what do you mean here?For any number that you're expressing as a fraction (eg, 50% = 5/10), you can estimate the formal uncertainty in your fraction as a function of your numerator and denominator, assuming that the distribution and sampling are binomial (instead of Poissonian or Gaussian). The more samples you have, the better your confidence on the fraction will be. So for example: the binomial confidence on 5/10 = 50% += 15%, but the confidence is better for 10/20 = 50% += 10%. It's purely statistical - one way to think about it is how much the value would have been likely to change if we added or subtracted a few more randomly selected galaxies.
this is the result of an early (and evolving) version of the RGZ
algorithm. It only considers "total agreement" - users must match all
radio components in each galaxy exactly, or it's considered wrong.Is this used (or has this been used) to evaluate/score/etc ordinary
RGZ zooites' clicks so far too?Yes - I did comparisons of the RGZ users' classifications of the same sample and compared it to the experts. Choosing the 20 objects here involved a mix of galaxies where majority of the users agreed with the science team (most of them), and a couple of cases where they don't.
Examining some of these images manually and talking to each other
after the fact, there were a few cases where it's clear that we agreed
on the overall morphology, but occasionally missed a tiny radio
component and thus were flagged by the pipeline. I'm trying to adapt
the consensus algorithm in order to account for these measures of
partial agreement - the more information we can get out of the clicks,
the better the final identifications will be.Here's another aspect I think you should work on (and I'd be happy to
help): science team member DocR made a comment - somewhere in RGZ Talk- to the effect that ARG fields with more than one independent source will be very difficult to assess, in that the RGZ algorithm(s) won't
really know how to handle independent radio sources which are not in
the center. After reading that, I pretty much stopped marking such
independent sources, and I suspect several of the other 'high click
count' zooites did the same too. Of course, in some of these cases the
ambiguity (?) can be removed because the second (etc) source(s) will
turn up in a different ARG field; however, there are also quite a few
ARG fields with multiple, independent sources (e.g. some centers of
rich clusters), and in these fields this 'appears in a separate ARG
field' won't help much.
You're very correct. We're experimenting with a couple possible techniques to help resolve this, including putting in explicit dependences on the distance to the center of the image and the size of the radio component.
Could you say a bit more about these consensus RGZ algorithms please?
Sure, although it's definitely work in progress. It's been developed by a researcher in the Robotics Research Group at Oxford, and is called "Independent Bayesian Classifier Combination". The word "Bayesian" refers to Bayes' theorem, which is extremely well known in the field of statistics. It means that to assess the probability of your belief (or measurement, if you will), you have to take into account "prior" knowledge of how often that result is likely to occur. This prior can be updated if necessary, as more data comes in. So we're still combining the votes together of independent classifiers; the main difference is that the "weights" of each classification are optimized based on the behavior of the user and the likelihood of their response, which should give a much more accurate answer overall. We used this algorithm to analyze the Galaxy Zoo: Supernova data a couple of years ago, and it worked very well for that - I think it may be promising for many, if not all Zooniverse projects.
Thanks for the very good questions. As I said before, the main goal is to calibrate the relative responses of users and science team members as accurately as we can, and we're grateful for your help in testing out this new analysis technique. We'll keep you updated on the results!
Posted
- to the effect that ARG fields with more than one independent source will be very difficult to assess, in that the RGZ algorithm(s) won't
-
by
JeanTate
in response to KWillett's comment.
Wow, thank you very much for the extensive reply, KWillett! 😃
Very much looking forward to hearing more about analyses, techniques, calibrations, etc.
And if you don't mind, I've got some more questions, which I'll post later today (hopefully).
Posted
-
by
JeanTate
in response to KWillett's comment.
Once again, many thanks for the wonderfully detailed post/reply! 😃
Not exactly "today" (i.e. ~nine days' ago), and only on one aspect (more questions later, promise) ...
It doesn't require agreement for the location of the IR counterpart, since that's not a clear distinction. We measure the best fit position using a clustering algorithm for that, but users are almost always in agreement on the location of the counterpart if they agree on the radio lobes.
.
Did any of the objects have a notably bimodal classification distribution? I.e. one where a significant minority of science team members agreed on a classification that was different from that of the majority?
For some galaxies, yes - about 15% of the sample overall.
Sometimes I get distracted and for much of the past week or so I've been trying to get a ~consensus view of whether certain FIRST radio sources are apparently emission from the nuclei of particular galaxies in 17 different fields (see p21 of the Hourglass sources associated with spiral galaxies thread), as well as looking into SDSS/WISE/FIRST 'offsets' (see pp2-4 of the Relative - radio/IR - positional accuracy? thread).
While I realize that the problem/challenge of determining the host of particular FIRST radio emission, from zooites' clicks and WISE sources, is not the primary goal of RGZ, it is surely something which is (or will be) of great interest. Also, my very limited investigation is certainly not representative (the selection biases are surely extreme!). However, if I may be so bold, the results are certainly interesting, and possibly rather unexpected! 😮
Would any reader care to comment?
Posted
-
by
JeanTate
in response to KWillett's comment.
Here's a question I meant to ask some time ago, but ...
For any number that you're expressing as a fraction (eg, 50% = 5/10), you can estimate the formal uncertainty in your fraction as a function of your numerator and denominator, assuming that the distribution and sampling are binomial (instead of Poissonian or Gaussian). The more samples you have, the better your confidence on the fraction will be. So for example: the binomial confidence on 5/10 = 50% += 15%, but the confidence is better for 10/20 = 50% += 10%. It's purely statistical - one way to think about it is how much the value would have been likely to change if we added or subtracted a few more randomly selected galaxies.
If p is the percentage matched for an expert, and N the number of galaxies, then the '1 sigma' binomial uncertainty will be √(p(1-p)/N), I think. So if p = 0.89 and N = 100, the binomial uncertainty will be ±0.031. Doing some 'slide scraping' on the chart posted in the blog post, I see that the 6th expert has a percentage of 89% and error bars of 6.3% (top to bottom). Cool, the difference is less than one pixel! 😃 Doubly cool as all data points match within ~1 pixel, except for the 5th expert (the N=25 one).
However, the blue error bars do not appear to be symmetric about the top of the red bars! 😮 And the bars for the 5th expert are the most unbalanced. In all nine cases, the + bar is closer to the top of the red bar than the - bar. Is this due to some quirk of the plotting or conversion to a jpg image? Or did you use a slightly different method to estimate the uncertainties?
Posted
-
by
KWillett
scientist, admin, translator
in response to JeanTate's comment.
Hi Jean,
Good catch - I oversimplified my previous explanation on the error bars. They are indeed asymmetric, which does make some intuitive sense. Imagine if you had classified as radio sources 5 galaxies out of a total of 10, for example. If you decided that one additional one was a radio source, you have a sample that's 16% bigger (6/5 -1). If you decided that one of the radio sources was incorrect and wanted to remove it, now you have a sample that's 20% smaller (1 - 4/5). So binomial confidence bars are asymmetric - the error toward lower fractions (smaller numerators) will always be bigger.
A very useful paper showing derivations of this (although math-y in parts) is Cameron (2011).
Posted
-
by
dosey
I feel very confused about this project classification.
The green highlights are okay but many seem to me to suggest they are like bullets shot out from an IR to one side of it, especially where there are two or more in a line or possibly just off a line of sight but seem connected in some shape. Is there a more detailed tutorial? I am marking an IR bright or dull. I don't know what the 'pink' blob is. There are also blue blobs without contours, are they faint radio or hot IR?
Is this project still running? The posts seem old. The comments place shows i have been shown some images 3 times. i feel totally confused!
Posted
-
by
JeanTate
in response to dosey's comment.
Hi dosey,
I'm not sure what "green highlights" you are referring to, so I can't really comment (can you clarify please?). In particular, do they - and "the 'pink' blob" - refer to anything mentioned in this Discussion thread?
Is this project still running?
If you're referring to Gold standard images, then no, it's long over.
It was a bit of a side-project, run by Kyle Willett, with some professional astronomers doing the 'clicking'. It was an important part of RGZ as a whole, a sort of 'ground truth' exercise: how do experts' classifications differ from those done by us ordinary citizen scientists? Not on simple radio sources like "compact" or "double lobe", but ones with complicated shapes ("morphologies" is the technical term).
Hope this helps, and happy hunting! 😃
Posted
-
 by
ivywong
scientist, admin
in response to dosey's comment.
by
ivywong
scientist, admin
in response to dosey's comment.
Hi Dosey,
Don't worry about being a little confused by some of the images because there are some very complex sources out there. This is why each subject is classified by many people. We are using the statistical information from multiple classifiers to help us determine the locations of the connected radio components with that of their hosts.In terms of running, yes, we are definitely still running.
cheers,
IvyPosted